Random Exploration
Table of Contents
1 Directory listing
2 Aim
To determine the expected time it would take to "explore" a given percentage of a digital area or volume if pixels or voxels are chosen, with replacement, at random. For example, if we have a 7×7×7 grid, how long, on average, would it take to sample 70% of the volume if voxels are chosen completely at random?
3 Methodology and Results
The following simple function will run our experiment. It takes a number of elements (pixels or voxels), and a desired percentage required to be seen. It then randomly samples the space until that percentage has been filled, and returns the number of samples required, \(n\).
def simulate(n_elements, percentage):
    n = 0
    elements_seen = [0] * n_elements
    while sum(elements_seen) < percentage * n_elements:
       element_idx = random.randrange(n_elements)
       elements_seen[element_idx] = 1
       n += 1
    return n
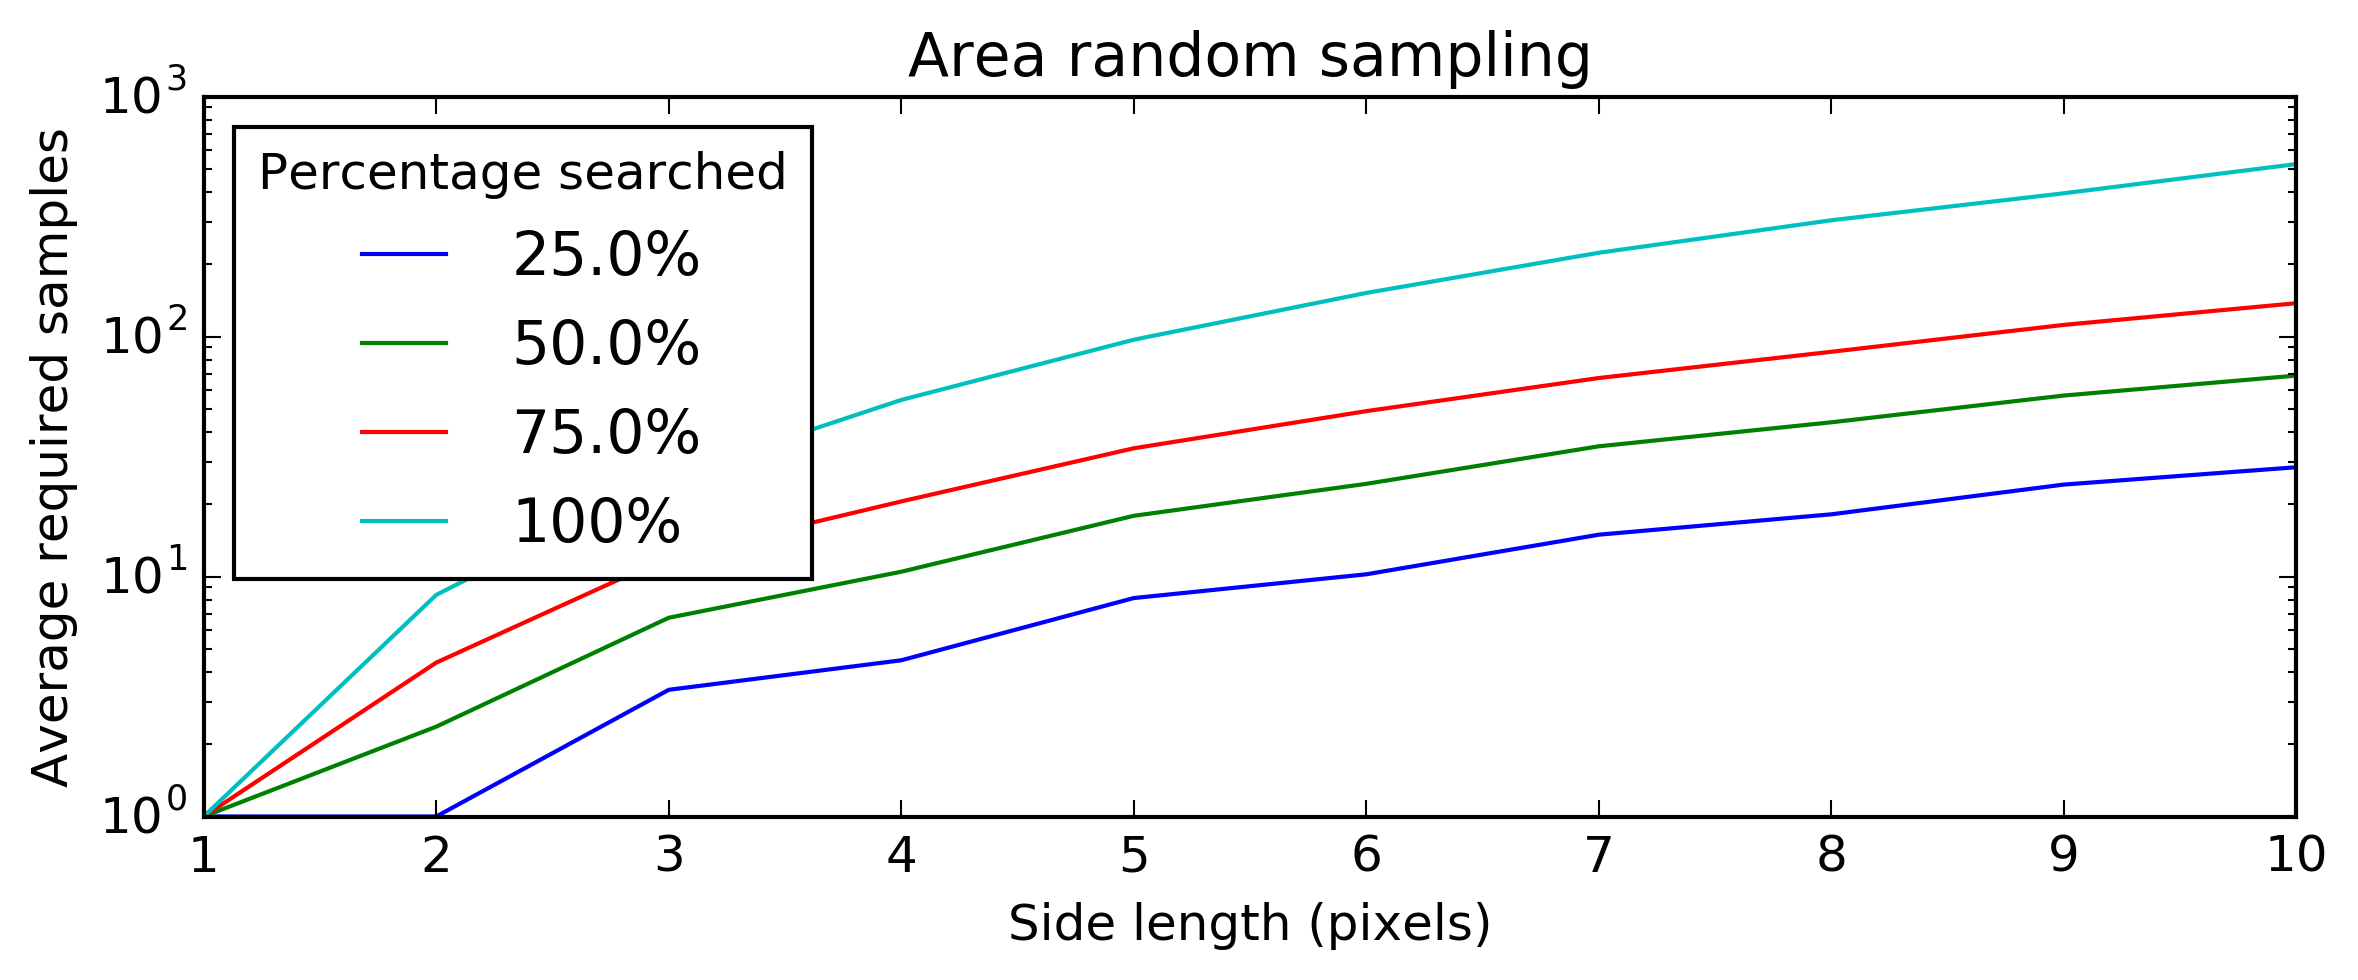
Let's see how this scales with a 2D area.
import random
import statistics
import matplotlib
matplotlib.use('Agg')
import matplotlib.pyplot as plt

plt.figure(figsize=(9, 3))

def simulate(n_elements, percentage):
    n = 0
    elements_seen = [0] * n_elements
    while sum(elements_seen) < percentage * n_elements:
       element_idx = random.randrange(n_elements)
       elements_seen[element_idx] = 1
       n += 1
    return n

n_tests = 500
max_side_l = 10
for percent in [0.25, 0.5, 0.75, 1]:
    x = range(1, max_side_l+1)
    y = []
    for side in x:
        n = statistics.mean(simulate(side*side, percent)
                            for i in range(n_tests))
        y.append(n)
    plt.plot(x, y, label=str(percent * 100) + '%')

plt.legend(title='Percentage searched', loc='upper left')
plt.title('Area random sampling')
plt.xlabel('Side length (pixels)')
plt.ylabel('Average required samples')
plt.yscale("log", nonposx='clip')
fig_file = 'area_results.png'
plt.savefig(fig_file, dpi=300, bbox_inches='tight')
return fig_file
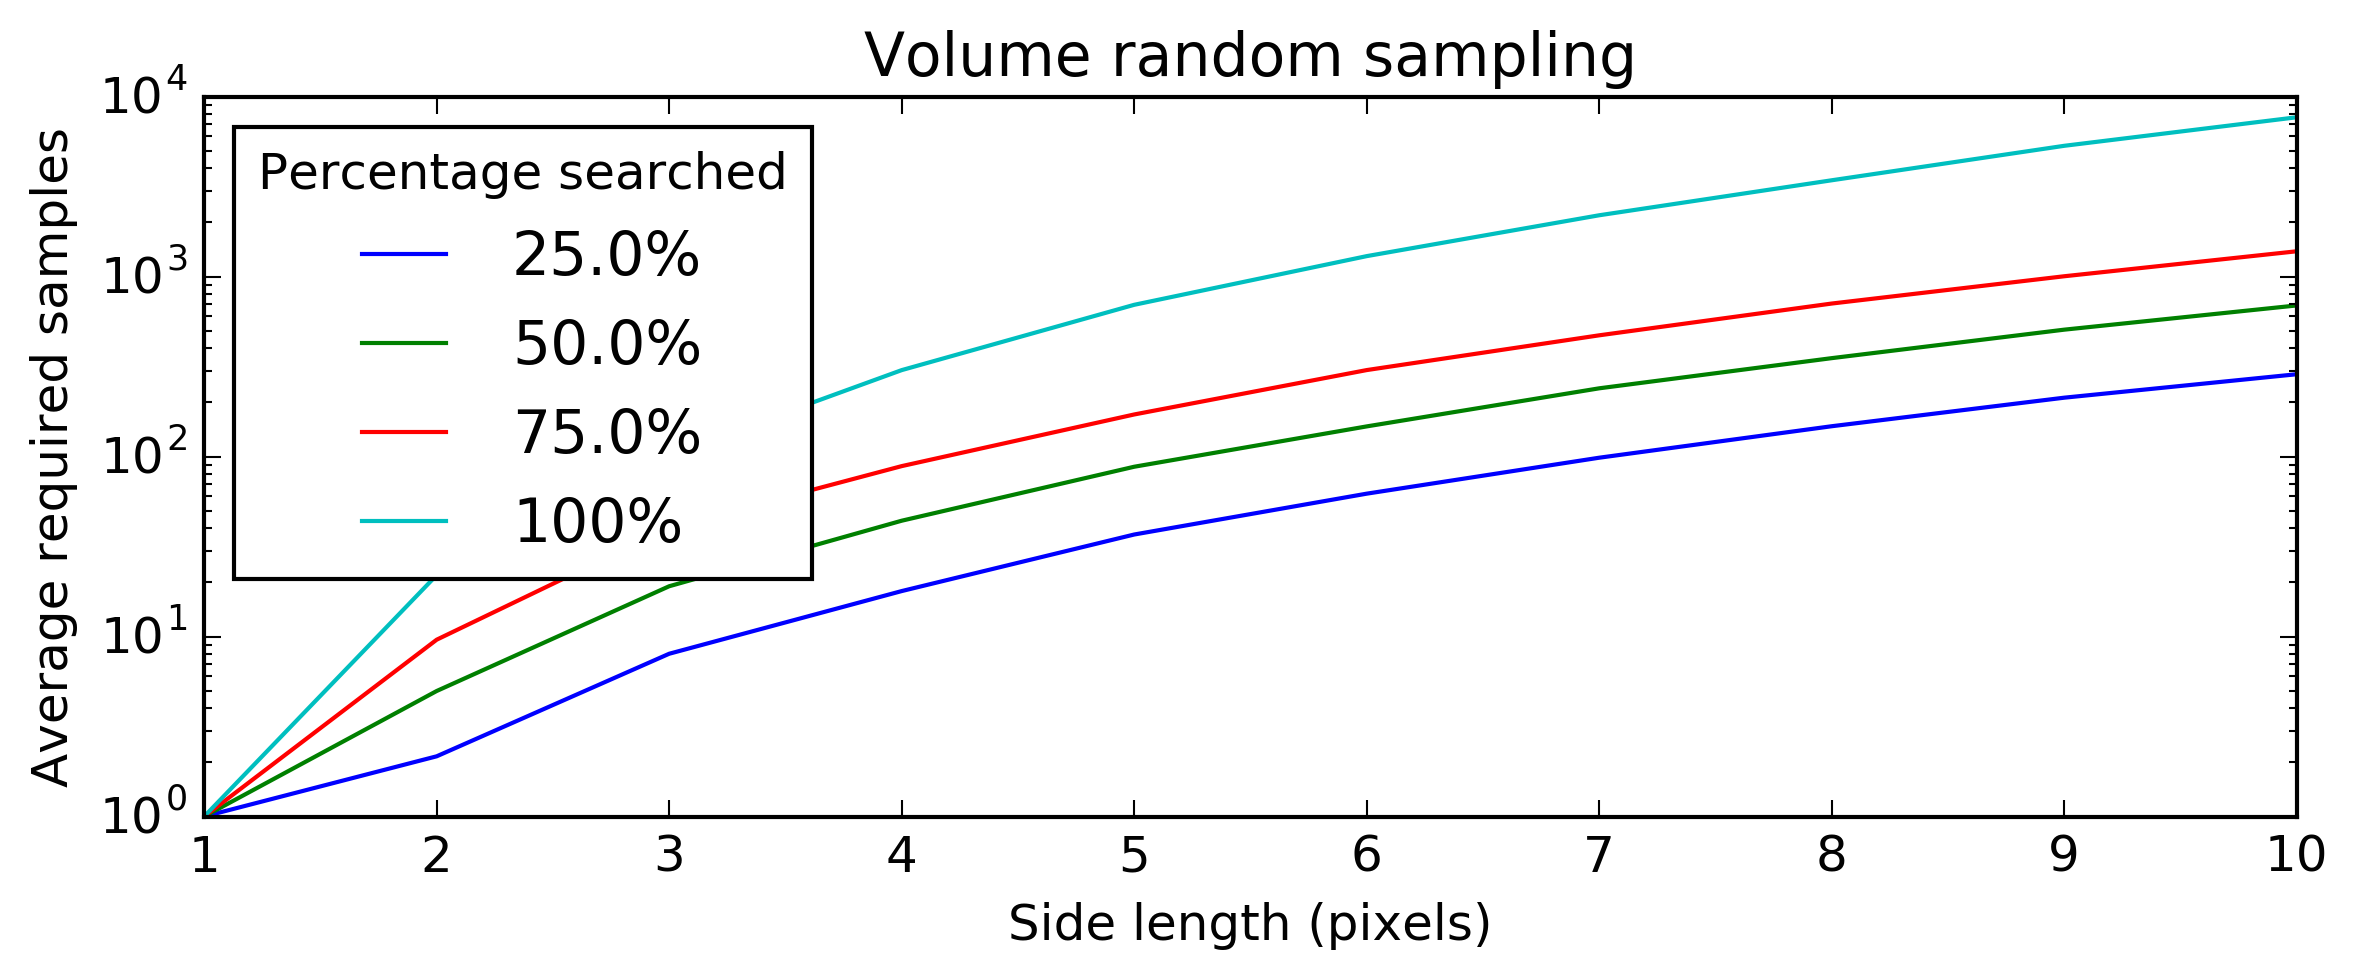
And with a 3D volume.
import random
import statistics
import matplotlib
matplotlib.use('Agg')
import matplotlib.pyplot as plt

plt.figure(figsize=(9, 3))

def simulate(n_elements, percentage):
    n = 0
    elements_seen = [0] * n_elements
    while sum(elements_seen) < percentage * n_elements:
       element_idx = random.randrange(n_elements)
       elements_seen[element_idx] = 1
       n += 1
    return n

n_tests = 50
max_side_l = 10
for percent in [0.25, 0.5, 0.75, 1]:
    x = range(1, max_side_l+1)
    y = []
    for side in x:
        n = statistics.mean(simulate(side*side*side, percent)
                            for i in range(n_tests))
        y.append(n)
    plt.plot(x, y, label=str(percent * 100) + '%')

plt.legend(title='Percentage searched', loc='upper left')
plt.title('Area random sampling')
plt.xlabel('Side length (pixels)')
plt.ylabel('Average required samples')
plt.yscale("log", nonposx='clip')
fig_file = 'volume_results.png'
plt.savefig(fig_file, dpi=300, bbox_inches='tight')
return fig_file